We traced 20 popular live chat statistics to their source. 16 are more than ten years old
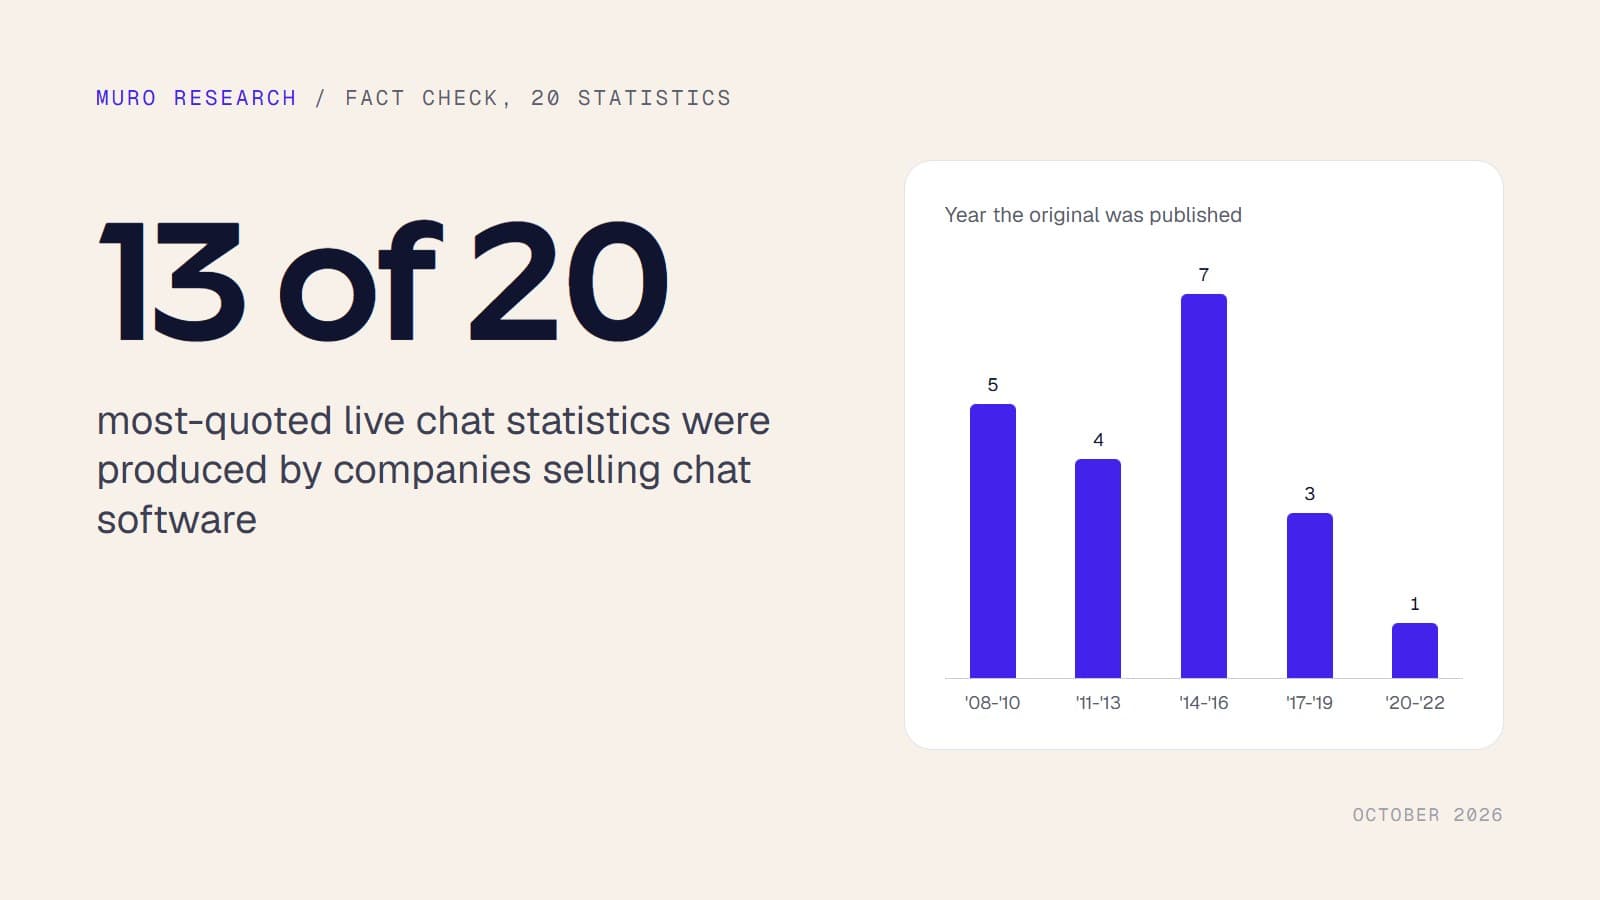
The same figures circulate on every "live chat statistics" page. We followed each citation back, link by link, to the document that first published it. 13 of the 20 were produced by companies that sell chat software, none comes from a controlled experiment, and one was on our own home page.
The muro team
muro.chat
- Published
- Reading time
- 12 min
On this page
Every live chat vendor publishes a page of statistics, and they all quote each other. Visitors who chat convert 2.8 times more. Live chat has 73% satisfaction. 77% of customers will not buy without it. The numbers are confident, the sources are a name in brackets, and the name changes from one page to the next.
We read ten of these pages in full, kept the 20 figures that came up repeatedly, and followed each citation back until we reached a document that publishes its own data, or until the trail ended. One of the 20 was on our own home page: "Visitors who chat convert up to 2.8x more often. That's Forrester's finding." We had it wrong, and we explain how below.
14 of 20
found in the original document
13 of 20
produced or paid for by a company that sells chat or support software
11.5 years
median age of the verified originals (published 2009 to 2018)
0
come from a controlled experiment
What we found at the end of each trail
Where the trail ended, for 20 live chat statistics
"Found in the original" means the number is in the document that first published it. It does not mean the number is sound or current.
View as table
| Where the trail ended, for 20 live chat statistics | |
|---|---|
| Found in the original | 14 |
| Original found, number not in it | 2 |
| Original no longer online | 2 |
| Could not trace | 2 |
Source: Citation chains followed by muro, 10 October 2026.
For 14 figures we read the number in the original document. For two, the document everyone cites exists but does not contain the number. For two, the original is gone and only the vendor's announcement survives. Two could not be traced to any study at all: "77% of customers won't buy without live chat" first appears in a 2016 blog post that cites "some studies", and "live chat increases conversions by 20%" ends at a chat vendor's product claim.
Most of them are more than ten years old
Year the original source was published
Number of the 20 statistics, by period. Hover or focus a column for the figures.
View as table
| Year the original source was published | Note | |
|---|---|---|
| 2008-2010 | 5 | Proactive chat delivers a 305% ROI; 63% are more likely to return to a site with live chat; 38% bought because of a good chat session; 44% say live chat is one of the most important website features; 77% won't buy without live chat |
| 2011-2013 | 4 | Live chat increases conversions by 20%; Live chat has 73% satisfaction, against 61% for email and 44% for phone; 79% prefer live chat for its immediacy; 42% prefer live chat, against 23% for email |
| 2014-2016 | 7 | Visitors who chat are 2.8x more likely to convert; Customers who chat spend 60% more per purchase; Chat brings 10% higher order value, 48% more revenue per chat hour, 40% conversion; Live chat has a 92% satisfaction rate; 53% prefer chat before calling; 62% expect live chat on mobile; 56% of 18 to 34 year olds prefer chat |
| 2017-2019 | 3 | 38% are more likely to buy from a company that offers chat; 21% of chat requests go unanswered; 90% expect an immediate response |
| 2020-2022 | 1 | Live chat has an 88% satisfaction rating (ACSI) |
Source: Original documents, dated from their content or file metadata. Compiled by muro, 10 October 2026.
16 of the 20 were published in 2015 or earlier. The pages that quote them are dated 2025 or 2026, and some originals have been re-dated without new data: one study from 2017 is now headed "2020" with identical figures, and a 2018 article now shows a 2025 date.
Who produced them, and how
13 of the 20 figures, 65%, were produced or paid for by a company that sells chat or customer service software. Five come from a single vendor, BoldChat, between 2009 and 2015. None comes from an experiment that compares sites with and without chat.
Type of evidence behind the 20 statistics
What the original source actually is, once the citation chain is followed to the end.
View as table
| Type of evidence behind the 20 statistics | |
|---|---|
| Survey | 11 |
| Vendor platform data | 3 |
| Single-company case study | 2 |
| No usable source | 2 |
| Mystery shopping | 1 |
| Marketing copy, no study | 1 |
Source: Classification by muro from the original documents, 10 October 2026.
Surveys dominate, and most ask a narrow group a narrow question: shoppers who had already used chat, people who already preferred it, mobile subscribers who had contacted their carrier online. When the figure travels, the group disappears and it becomes a fact about "customers".
All 20, traced
Links go to the original document or, when it is no longer online, to an archived copy. The downloadable dataset adds who each figure is usually credited to, the original wording, the sample and the evidence quotes.
The 2.8x on our own home page
Our home page opened with "Visitors who chat convert up to 2.8x more often. That's Forrester's finding, not ours." Here is what the trail shows.
“Chatters are 2.8x more likely to convert than visitors who don't chat.”
The sentence comes from a benchmark a chat vendor published on its own customers' data. It counts purchases only, on sites using its conversion tracking, and it does not say how many sites or which period. Above all, it compares visitors who chose to chat with visitors who did not. People who open a chat may already be closer to buying, so the gap cannot tell what adding chat does to a site. In the report's own worked example, 1.6% of visitors chat and total sales rise by 7.2%.
The same benchmark, three editions
"Chatters are N times more likely to convert than visitors who don't chat", as published by the same vendor.
View as table
| The same benchmark, three editions | Note | |
|---|---|---|
| 2009 | 4.1 | 4.1x in the 2009 edition. |
| 2012 | 7.5 | 7.5x in the 2012 edition. |
| 2015 | 2.8 | 2.8x in the 2015 edition. |
Source: BoldChat, Live Chat Performance Benchmarks, 2009, 2012 and 2015 editions (archived PDFs).
The multiple moved from 4.1x to 7.5x to 2.8x in six years. A figure that unstable describes the vendor's customer mix at a given time, not a property of live chat. The Forrester name comes from a 27 March 2018 analyst blog post by Kate Leggett, "Retailers Without Chat: A Missed Opportunity", which says "Forrester data reveals that site visitors who use web chat are 2.8x more likely to convert" without naming a report, and credits the next figure in the same paragraph to the vendor's benchmark. "Up to" is in neither source.
Six ways a statistic drifts
- One infographic becomes the hub. Eleven of the 20 figures appear on a single 2017 infographic, itself compiled from eight links to other articles. Several pages now call it "an Invesp survey". It was not a survey.
- The relay becomes the source. eMarketer reported a vendor survey in 2009 and is now credited with the 63%. Econsultancy quoted two studies in one paragraph and is now credited with both.
- A case study becomes a law. The 305% ROI is one US bank in 2008, in a study the chat vendor paid for. The 10% / 48% / 40% trio is one online photo service.
- The base disappears. The 73% satisfaction figure describes only the 24% of respondents who had used chat. The 63% and 38% come from about 131 people who had already chatted.
- Numbers mutate. Email satisfaction is 61% in the source and 51% on the infographic. A "40% conversion rate for live chat" became a "40% increase in conversions".
- Credits wander. On pages published in 2025 and 2026, the 305% is credited to Freshworks, a 2017 Kayako figure to GoSquared, and another to CrazyEgg. None of them produced it.
How to check a statistic before you quote it
- Follow the link to the end. If the page you land on cites another page, keep going. Stop only at a document that describes its own data.
- Find the base. Who was asked or measured, how many, in which country, and was it everyone or only people who already use chat?
- Read the exact wording. "Prefer", "use", "would use" and "more likely to" are different claims.
- Check who paid. A vendor study is not worthless, but say so when you quote it.
- Check the date of the data, not the date of the page that quotes it.
- Ask what was compared. People who chose to chat against people who did not is a correlation, not the effect of adding chat.
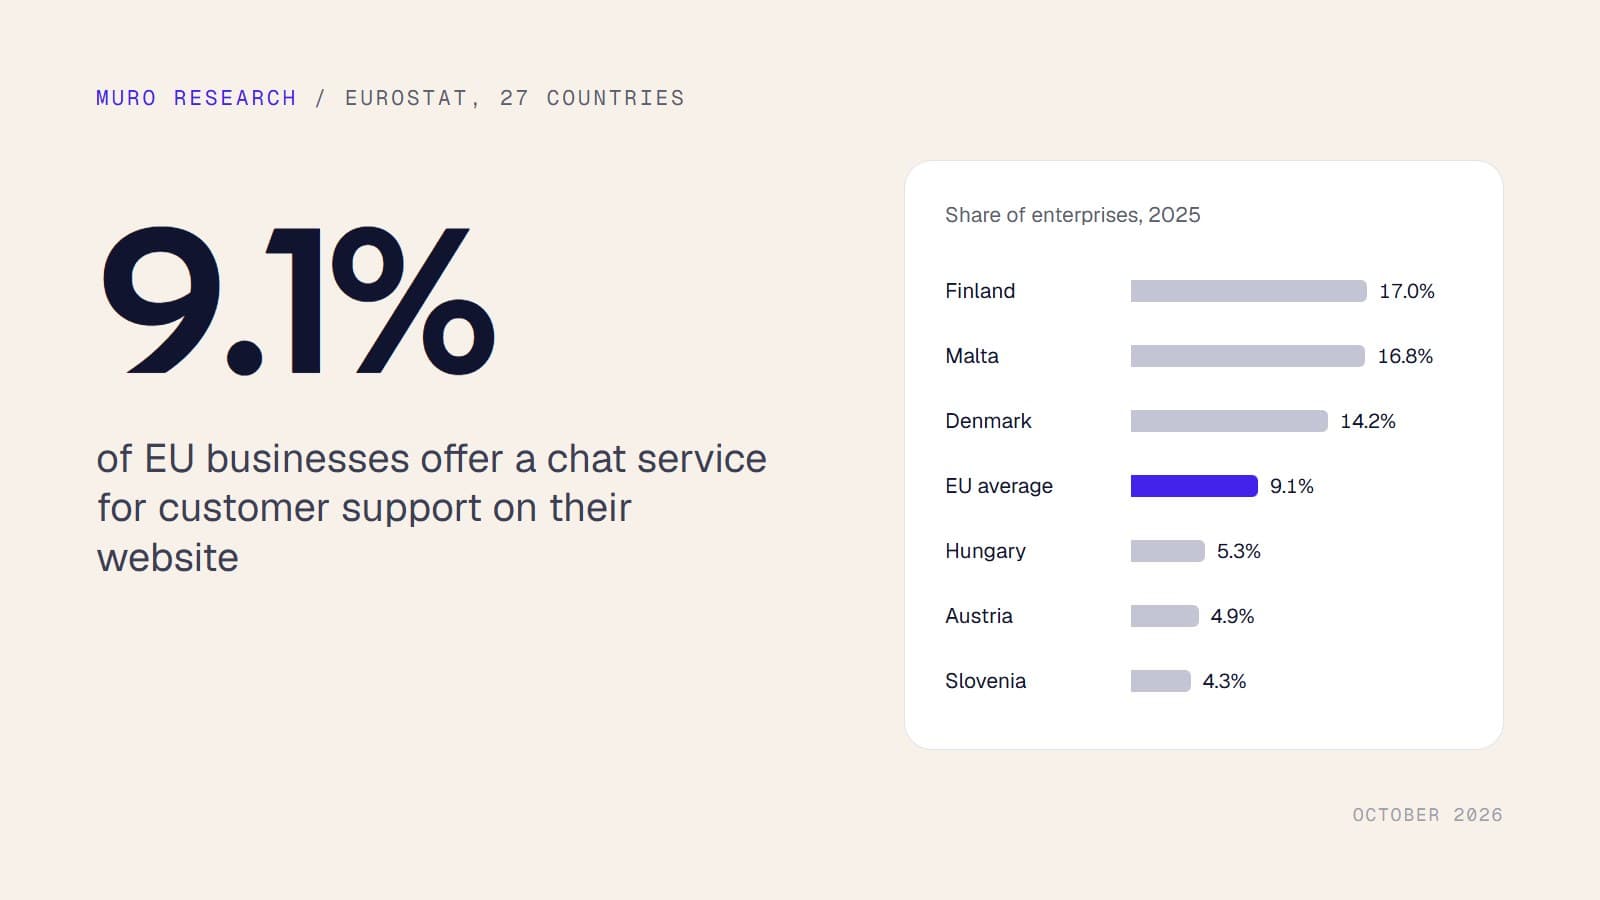
Some recent numbers do hold up because they come from official statistics with a published method. Eurostat measures how many EU businesses offer chat on their website, by country and size: we charted it in Only 9.1% of EU businesses offer chat support on their website.
Method and limits
- Which statistics. We read ten "live chat statistics" pages in full, from vendors and agencies, dated 2015 to 2026, and kept the figures that appeared on at least two of them. It is a reading, not a frequency count.
- Tracing. For each figure we followed the citation chain one link at a time and recorded a fact only with the page or PDF in front of us. Dead pages were read from the Internet Archive; the archive URL is in the dataset.
- Quotes. Every quote in the dataset was compared by script with the saved copy of its source: 98 matched, 3 could not be checked by machine (two read from images, one from a tool-rendered page).
- What "found" means. The number is in the document that first published it. We did not re-run anyone's survey, and a verified figure can still be weak or out of date.
- Paywalls. Two Forrester reports were read through their public abstract or a licensed reprint. A full ACSI study behind a download form was not checked.
- Inference. The link between the "77%" claim and a 2009 survey on wanting help from a real person is our inference, not a proven chain. The dataset labels it as such.
Related research: what 25 chat widgets do before you click anything, live chat pricing compared and where live chat tools store your data.
Sources
- 1BoldChat (chat vendor), 2015 benchmark: "Visitors who chat are 2.8x more likely to convert" (accessed 2026-10-10)
- 2BoldChat (chat vendor), 2015 benchmark: "Customers who chat spend 60% more per purchase" (accessed 2026-10-10)
- 3LivePerson (chat vendor) marketing copy, about 2011: "Live chat increases conversions by 20%" (accessed 2026-10-10)
- 4Forrester Consulting, paid by LivePerson, 2008: "Proactive chat delivers a 305% ROI" (accessed 2026-10-10)
- 5eDigitalResearch (UK research agency), 2013: "Live chat has 73% satisfaction, against 61% for email and 44% for phone" (accessed 2026-10-10)
- 6BoldChat (chat vendor), 2012 survey: "79% prefer live chat for its immediacy" (accessed 2026-10-10)
- 7Bold Software (chat vendor), 2009 survey: "63% are more likely to return to a site with live chat" (accessed 2026-10-10)
- 8Bold Software (chat vendor), 2009 survey: "38% bought because of a good chat session" (accessed 2026-10-10)
- 9Kayako (help desk vendor), 2017 survey: "38% are more likely to buy from a company that offers chat" (accessed 2026-10-10)
- 10Forrester Research, 2010: "44% say live chat is one of the most important website features" (accessed 2026-10-10)
- 11Forrester report, 2014, citing one LivePerson customer: "Chat brings 10% higher order value, 48% more revenue per chat hour, 40% conversion" (accessed 2026-10-10)
- 12Zendesk (support software vendor), Q1 2015 benchmark: "Live chat has a 92% satisfaction rate" (accessed 2026-10-10)
- 13SuperOffice (CRM vendor), 2017 study: "21% of chat requests go unanswered" (accessed 2026-10-10)
- 14HubSpot Research (chat vendor), 2018 survey: "90% expect an immediate response" (accessed 2026-10-10)
- 15inContact (contact centre vendor) with Harris Interactive, 2015: "53% prefer chat before calling" (accessed 2026-10-10)
- 16J.D. Power, 2013: "42% prefer live chat, against 23% for email" (accessed 2026-10-10)
- 17Moxie Software (chat vendor), 2014 poll: "62% expect live chat on mobile" (accessed 2026-10-10)
- 18No study found. First seen in a 2016 blog post citing "some studies": "77% won't buy without live chat" (accessed 2026-10-10)
- 19Software Advice (software comparison site), 2015: "56% of 18 to 34 year olds prefer chat" (accessed 2026-10-10)
- 20Credited to the ACSI: "Live chat has an 88% satisfaction rating (ACSI)" (accessed 2026-10-10)